
Home prices in 2024 — a look ahead
| Month, Year | National YoY Change in HPI | East North Central YoY Change in HPI | East South Central YoY Change in HPI | Middle Atlantic YoY Change in HPI | Mountain YoY Change in HPI | New England YoY Change in HPI | Pacific YoY Change in HPI | South Atlantic YoY Change in HPI | West North Central YoY Change in HPI | West South CentraI YoY Change in HPI |
|---|---|---|---|---|---|---|---|---|---|---|
| October, 2023 | 6.3% | 9.1% | 6.3% | 9.9% | 2.6% | 9.7% | 2.8% | 7.2% | 6.3% | 3.6% |
| September, 2023 | 6.2% | 8.3% | 5.2% | 8.3% | 3.5% | 11.6% | 2.2% | 7.4% | 6.3% | 4.3% |
| August, 2023 | 5.8% | 8.4% | 5.2% | 8.8% | 2.7% | 8.9% | 2.9% | 6.5% | 6.6% | 3.1% |
| July, 2023 | 4.7% | 7.1% | 4.9% | 7.1% | 0.4% | 8.3% | 0.8% | 6.1% | 5.7% | 2.7% |
| June, 2023 | 3.4% | 5.9% | 4.2% | 5.0% | -1.2% | 6.9% | -0.3% | 4.4% | 5.1% | 1.8% |
| May, 2023 | 3.1% | 5.8% | 4.9% | 5.2% | -2.8% | 3.9% | -1.4% | 4.3% | 4.4% | 2.6% |
| April, 2023 | 3.3% | 5.6% | 5.8% | 6.1% | -2.2% | 5.5% | -3.3% | 5.0% | 4.2% | 3.5% |
| March, 2023 | 3.9% | 5.6% | 6.7% | 4.9% | -1.9% | 5.7% | -2.9% | 6.3% | 5.5% | 4.9% |
| February, 2023 | 4.6% | 5.4% | 7.9% | 5.3% | 1.3% | 6.5% | -2.3% | 7.2% | 5.3% | 5.6% |
| January, 2023 | 5.3% | 5.8% | 8.0% | 5.7% | 1.9% | 6.9% | -1.3% | 9.2% | 5.9% | 5.5% |
| December, 2022 | 6.8% | 7.1% | 9.8% | 7.4% | 3.2% | 5.9% | 0.7% | 10.4% | 6.2% | 7.8% |
| November, 2022 | 8.2% | 7.9% | 8.9% | 8.9% | 5.6% | 8.3% | 2.4% | 12.0% | 8.4% | 9.4% |
| October, 2022 | 9.7% | 8.9% | 11.8% | 8.5% | 8.4% | 10.0% | 4.7% | 13.9% | 8.5% | 10.6% |
| September, 2022 | 11.0% | 10.3% | 13.6% | 10.3% | 9.2% | 9.0% | 7.0% | 15.2% | 9.6% | 11.2% |
| August, 2022 | 11.8% | 10.5% | 14.0% | 10.6% | 10.2% | 11.7% | 7.6% | 15.8% | 10.1% | 13.3% |
| July, 2022 | 13.6% | 11.5% | 15.9% | 11.8% | 14.4% | 11.5% | 9.9% | 18.4% | 11.2% | 14.7% |
| June, 2022 | 16.0% | 12.7% | 17.8% | 13.9% | 17.7% | 14.2% | 13.1% | 21.6% | 12.3% | 17.3% |
| May, 2022 | 17.8% | 14.8% | 18.5% | 13.9% | 22.0% | 16.0% | 15.4% | 23.0% | 14.1% | 19.3% |
| April, 2022 | 18.6% | 14.9% | 19.1% | 13.8% | 23.4% | 17.4% | 18.3% | 23.5% | 15.3% | 19.0% |
| March, 2022 | 18.8% | 15.2% | 20.5% | 15.1% | 24.6% | 16.8% | 19.5% | 22.7% | 14.3% | 18.2% |
| February, 2022 | 18.9% | 15.1% | 20.1% | 15.2% | 24.1% | 17.7% | 19.7% | 23.4% | 14.7% | 18.5% |
| January, 2022 | 18.2% | 14.6% | 19.2% | 13.7% | 23.3% | 16.1% | 20.3% | 21.5% | 13.7% | 18.4% |
| December, 2021 | 17.8% | 14.0% | 18.8% | 13.3% | 23.3% | 16.4% | 19.5% | 21.0% | 14.1% | 18.2% |
| November, 2021 | 17.6% | 14.1% | 19.4% | 13.8% | 23.2% | 15.5% | 19.0% | 20.5% | 13.3% | 18.3% |
| October, 2021 | 17.5% | 13.9% | 18.3% | 14.4% | 23.7% | 15.9% | 19.7% | 19.8% | 13.5% | 17.3% |
| September, 2021 | 17.7% | 14.3% | 17.8% | 14.3% | 23.8% | 17.9% | 19.6% | 20.0% | 13.8% | 17.9% |
| August, 2021 | 18.3% | 15.1% | 18.3% | 15.3% | 25.3% | 18.4% | 21.0% | 20.5% | 14.4% | 16.9% |
| July, 2021 | 19.1% | 16.1% | 18.3% | 17.7% | 25.3% | 20.9% | 21.5% | 20.3% | 15.6% | 17.7% |
| June, 2021 | 18.9% | 17.0% | 17.9% | 18.1% | 25.0% | 21.6% | 21.5% | 19.4% | 15.7% | 16.2% |
| May, 2021 | 18.1% | 16.1% | 17.0% | 17.3% | 23.3% | 21.8% | 21.5% | 18.1% | 15.8% | 15.4% |
| April, 2021 | 15.8% | 14.4% | 14.7% | 16.0% | 20.3% | 18.1% | 17.7% | 16.1% | 13.2% | 14.0% |
| March, 2021 | 14.1% | 12.8% | 13.3% | 13.6% | 17.4% | 16.3% | 15.7% | 15.0% | 12.4% | 12.0% |
| February, 2021 | 12.7% | 12.2% | 12.3% | 12.2% | 15.7% | 13.8% | 14.4% | 12.3% | 11.4% | 11.4% |
| January, 2021 | 12.3% | 12.3% | 11.8% | 12.8% | 14.8% | 13.9% | 13.1% | 12.2% | 11.3% | 10.1% |
| December, 2020 | 11.7% | 11.8% | 11.4% | 11.6% | 14.1% | 13.6% | 12.6% | 12.1% | 10.0% | 9.4% |
| November, 2020 | 11.2% | 10.5% | 11.8% | 11.2% | 13.8% | 12.8% | 12.0% | 11.3% | 10.0% | 9.0% |
| October, 2020 | 10.6% | 10.6% | 10.7% | 10.6% | 12.5% | 12.4% | 11.0% | 10.5% | 9.8% | 8.9% |
| September, 2020 | 9.5% | 9.4% | 9.4% | 9.7% | 11.5% | 10.7% | 9.8% | 9.2% | 9.0% | 7.8% |
| August, 2020 | 8.3% | 8.0% | 9.1% | 7.9% | 10.2% | 8.3% | 8.1% | 8.9% | 7.9% | 6.9% |
| July, 2020 | 6.9% | 7.0% | 7.4% | 6.1% | 8.6% | 7.0% | 6.7% | 7.4% | 6.6% | 5.7% |
| June, 2020 | 5.9% | 5.7% | 6.1% | 4.8% | 7.8% | 5.1% | 5.9% | 6.4% | 5.7% | 5.4% |
| May, 2020 | 5.2% | 5.2% | 6.1% | 5.0% | 6.8% | 4.3% | 4.7% | 5.4% | 5.1% | 4.2% |
| April, 2020 | 6.0% | 5.9% | 6.4% | 5.8% | 7.6% | 5.8% | 6.2% | 6.2% | 5.7% | 5.1% |
| March, 2020 | 6.3% | 6.6% | 6.7% | 6.0% | 9.0% | 6.3% | 6.4% | 6.6% | 5.1% | 4.8% |
| February, 2020 | 6.5% | 6.1% | 6.6% | 6.1% | 8.9% | 5.4% | 6.5% | 7.5% | 5.9% | 5.0% |
| January, 2020 | 6.0% | 6.1% | 6.7% | 5.0% | 7.6% | 6.1% | 6.0% | 6.7% | 5.0% | 4.8% |
| December, 2019 | 5.9% | 5.8% | 6.7% | 5.2% | 8.1% | 5.4% | 5.5% | 5.8% | 5.8% | 5.2% |
| November, 2019 | 5.3% | 6.2% | 4.5% | 4.6% | 6.7% | 5.3% | 5.2% | 5.8% | 4.9% | 3.9% |
| October, 2019 | 5.4% | 4.9% | 5.8% | 5.0% | 7.1% | 4.3% | 4.9% | 6.4% | 5.0% | 4.6% |
| September, 2019 | 5.2% | 5.2% | 6.5% | 4.1% | 6.9% | 4.5% | 4.4% | 5.6% | 5.3% | 4.5% |
| August, 2019 | 4.7% | 5.1% | 5.0% | 4.4% | 6.5% | 4.7% | 4.0% | 4.7% | 4.8% | 4.0% |
| July, 2019 | 4.8% | 5.2% | 6.0% | 3.6% | 7.1% | 4.5% | 4.4% | 4.9% | 4.0% | 4.2% |
| June, 2019 | 4.9% | 5.0% | 5.5% | 3.8% | 6.1% | 4.1% | 4.2% | 5.6% | 4.6% | 4.4% |
| May, 2019 | 5.0% | 5.4% | 4.9% | 4.2% | 7.0% | 4.4% | 4.6% | 5.3% | 4.6% | 4.3% |
| April, 2019 | 5.1% | 5.2% | 6.7% | 4.2% | 7.6% | 5.0% | 4.4% | 5.1% | 5.1% | 3.9% |
| March, 2019 | 4.8% | 5.1% | 5.3% | 3.1% | 6.3% | 4.8% | 4.2% | 5.3% | 5.1% | 4.3% |
| February, 2019 | 4.9% | 5.1% | 6.0% | 4.3% | 6.8% | 4.6% | 3.6% | 5.3% | 5.3% | 3.6% |
| January, 2019 | 5.3% | 4.9% | 5.4% | 4.5% | 7.8% | 4.7% | 4.6% | 5.9% | 4.8% | 5.3% |
| December, 2018 | 5.4% | 5.2% | 5.7% | 4.7% | 7.7% | 4.9% | 4.9% | 6.1% | 5.6% | 4.2% |
| November, 2018 | 5.6% | 5.5% | 6.5% | 5.1% | 7.9% | 4.5% | 5.1% | 6.2% | 4.9% | 4.5% |
| October, 2018 | 5.7% | 6.1% | 5.4% | 4.0% | 8.5% | 5.2% | 6.0% | 5.8% | 5.7% | 4.5% |
| September, 2018 | 5.7% | 6.1% | 5.5% | 4.1% | 9.0% | 4.7% | 5.7% | 6.4% | 5.4% | 4.2% |
| August, 2018 | 6.0% | 5.9% | 5.7% | 4.1% | 8.9% | 5.0% | 6.7% | 6.5% | 5.2% | 5.1% |
| July, 2018 | 6.1% | 5.9% | 5.0% | 5.0% | 8.9% | 4.6% | 6.9% | 6.7% | 6.0% | 4.7% |
| June, 2018 | 6.2% | 6.4% | 5.7% | 5.1% | 9.6% | 5.1% | 7.1% | 6.2% | 5.6% | 5.1% |
| May, 2018 | 6.3% | 5.9% | 6.2% | 5.3% | 8.9% | 5.5% | 7.1% | 7.1% | 5.1% | 4.6% |
| April, 2018 | 6.3% | 6.2% | 5.0% | 5.1% | 9.2% | 4.6% | 7.9% | 6.7% | 5.6% | 5.1% |
| March, 2018 | 6.9% | 6.0% | 5.7% | 7.0% | 9.5% | 4.8% | 8.4% | 7.2% | 6.1% | 6.1% |
| February, 2018 | 7.2% | 6.8% | 5.8% | 5.3% | 9.3% | 6.8% | 9.5% | 7.6% | 5.9% | 6.6% |
| January, 2018 | 7.0% | 6.8% | 7.2% | 5.6% | 9.5% | 5.2% | 8.7% | 7.2% | 6.5% | 5.1% |
| December, 2017 | 6.2% | 5.7% | 4.4% | 4.8% | 8.7% | 5.3% | 8.2% | 6.3% | 5.0% | 5.7% |
| November, 2017 | 6.4% | 5.6% | 5.6% | 4.3% | 9.3% | 5.1% | 8.5% | 6.5% | 5.3% | 6.6% |
| October, 2017 | 6.2% | 5.5% | 6.1% | 4.6% | 7.9% | 5.6% | 8.2% | 6.0% | 5.1% | 6.1% |
| September, 2017 | 6.3% | 5.3% | 5.0% | 5.3% | 8.4% | 5.2% | 8.7% | 6.3% | 4.8% | 6.3% |
| August, 2017 | 6.3% | 5.3% | 5.4% | 4.9% | 8.2% | 5.7% | 8.9% | 6.7% | 5.5% | 5.6% |
| July, 2017 | 6.0% | 5.5% | 5.9% | 4.4% | 8.4% | 5.8% | 8.0% | 6.1% | 4.8% | 5.3% |
| June, 2017 | 6.0% | 5.1% | 5.9% | 3.8% | 7.9% | 5.5% | 8.5% | 6.0% | 5.5% | 5.6% |
| May, 2017 | 6.3% | 5.8% | 5.2% | 4.0% | 8.0% | 5.2% | 8.5% | 6.6% | 6.0% | 6.1% |
| April, 2017 | 6.4% | 6.0% | 5.2% | 4.9% | 8.0% | 5.4% | 7.8% | 6.9% | 5.2% | 6.2% |
| March, 2017 | 6.2% | 6.3% | 5.8% | 4.0% | 7.8% | 6.1% | 7.8% | 6.4% | 5.5% | 4.9% |
| February, 2017 | 6.4% | 6.6% | 5.9% | 4.2% | 8.1% | 5.6% | 7.5% | 7.0% | 4.1% | 6.2% |
| January, 2017 | 5.8% | 5.2% | 3.1% | 4.6% | 7.9% | 4.3% | 8.2% | 5.9% | 4.4% | 6.1% |
| December, 2016 | 6.1% | 5.6% | 5.8% | 4.2% | 8.2% | 4.4% | 7.6% | 6.8% | 4.4% | 5.9% |
| November, 2016 | 5.9% | 5.1% | 4.9% | 4.4% | 6.9% | 5.5% | 7.5% | 6.4% | 5.7% | 5.5% |
| October, 2016 | 5.9% | 5.4% | 4.9% | 3.9% | 8.6% | 4.5% | 7.7% | 6.7% | 5.2% | 4.9% |
| September, 2016 | 5.9% | 5.3% | 5.4% | 3.6% | 7.2% | 4.8% | 8.3% | 6.7% | 5.4% | 5.1% |
| August, 2016 | 5.8% | 5.9% | 5.0% | 3.1% | 7.4% | 3.6% | 7.6% | 6.8% | 4.7% | 5.3% |
| July, 2016 | 5.5% | 4.8% | 5.5% | 3.1% | 6.5% | 3.2% | 7.5% | 6.3% | 5.3% | 5.5% |
| June, 2016 | 5.5% | 4.2% | 4.7% | 3.6% | 7.8% | 2.6% | 7.7% | 6.4% | 4.8% | 5.3% |
| May, 2016 | 5.4% | 4.2% | 4.9% | 3.3% | 7.9% | 3.3% | 7.8% | 6.0% | 4.6% | 5.2% |
| April, 2016 | 5.7% | 4.4% | 3.8% | 3.0% | 8.0% | 4.2% | 8.2% | 6.8% | 4.9% | 5.5% |
| March, 2016 | 5.5% | 4.6% | 4.0% | 2.5% | 8.5% | 2.9% | 8.4% | 5.9% | 5.1% | 5.9% |
| February, 2016 | 5.1% | 3.5% | 4.7% | 3.2% | 7.1% | 2.2% | 8.3% | 5.1% | 6.3% | 4.5% |
| January, 2016 | 5.8% | 4.9% | 4.8% | 2.3% | 7.1% | 5.2% | 7.4% | 7.6% | 5.6% | 5.0% |
| December, 2015 | 5.3% | 4.0% | 5.4% | 2.0% | 7.2% | 4.4% | 8.1% | 6.1% | 4.8% | 5.1% |
| November, 2015 | 5.5% | 4.6% | 3.9% | 2.4% | 9.0% | 3.0% | 8.4% | 6.3% | 3.8% | 5.3% |
| October, 2015 | 5.5% | 3.9% | 4.5% | 2.9% | 7.4% | 3.3% | 7.7% | 6.7% | 4.2% | 6.2% |
| September, 2015 | 5.4% | 4.0% | 4.3% | 3.1% | 8.0% | 3.1% | 7.6% | 6.5% | 4.2% | 5.8% |
| August, 2015 | 5.1% | 3.1% | 4.3% | 2.6% | 7.5% | 3.0% | 7.0% | 6.3% | 4.3% | 6.0% |
| July, 2015 | 5.2% | 3.8% | 3.6% | 2.8% | 8.7% | 3.2% | 7.4% | 5.9% | 3.9% | 5.8% |
| June, 2015 | 5.2% | 4.9% | 3.7% | 2.0% | 6.9% | 3.7% | 7.3% | 5.7% | 3.7% | 6.3% |
| May, 2015 | 5.4% | 4.6% | 3.9% | 2.2% | 7.3% | 2.7% | 7.6% | 5.9% | 4.2% | 6.7% |
| April, 2015 | 5.1% | 3.9% | 4.8% | 2.0% | 6.8% | 3.7% | 7.5% | 5.6% | 3.5% | 6.0% |
| March, 2015 | 5.1% | 4.3% | 4.8% | 2.8% | 7.0% | 2.4% | 7.3% | 5.9% | 3.4% | 5.4% |
| February, 2015 | 5.0% | 4.4% | 3.1% | 2.1% | 6.4% | 4.3% | 7.1% | 5.9% | 3.3% | 5.8% |
| January, 2015 | 4.6% | 3.4% | 4.8% | 1.6% | 6.4% | 1.9% | 7.6% | 4.6% | 3.4% | 5.7% |
| December, 2014 | 4.8% | 4.1% | 3.1% | 2.7% | 7.0% | 2.6% | 7.5% | 5.0% | 4.2% | 5.3% |
| November, 2014 | 4.7% | 3.7% | 4.2% | 1.4% | 6.2% | 2.6% | 7.1% | 5.2% | 4.0% | 6.0% |
| October, 2014 | 4.2% | 4.2% | 2.5% | 1.2% | 4.6% | 2.4% | 6.7% | 4.4% | 3.9% | 5.5% |
| September, 2014 | 4.0% | 3.5% | 1.2% | 1.1% | 5.5% | 2.7% | 6.3% | 4.2% | 2.9% | 5.7% |
| August, 2014 | 4.4% | 3.8% | 3.3% | 1.8% | 5.9% | 2.3% | 7.6% | 3.8% | 3.2% | 5.9% |
| July, 2014 | 4.3% | 3.5% | 3.1% | 1.0% | 5.3% | 2.4% | 7.4% | 4.6% | 3.3% | 5.8% |
| June, 2014 | 4.5% | 3.6% | 2.0% | 1.8% | 6.4% | 2.8% | 8.4% | 5.1% | 3.3% | 4.4% |
| May, 2014 | 4.7% | 3.7% | 2.3% | 1.7% | 6.6% | 2.8% | 9.2% | 4.8% | 4.0% | 4.4% |
| April, 2014 | 5.3% | 4.5% | 2.5% | 1.6% | 7.2% | 2.5% | 10.6% | 5.8% | 5.0% | 4.8% |
| March, 2014 | 5.6% | 4.7% | 2.4% | 1.6% | 7.9% | 2.9% | 11.7% | 5.7% | 4.0% | 5.4% |
| February, 2014 | 6.2% | 5.1% | 3.3% | 1.4% | 10.3% | 2.0% | 13.3% | 6.4% | 4.3% | 5.6% |
| January, 2014 | 6.4% | 5.3% | 3.1% | 2.7% | 9.9% | 3.2% | 13.0% | 6.7% | 4.2% | 5.6% |
| December, 2013 | 6.7% | 6.0% | 2.9% | 1.8% | 9.7% | 2.0% | 14.0% | 7.6% | 3.8% | 6.4% |
| November, 2013 | 6.5% | 5.3% | 2.9% | 2.6% | 9.7% | 2.6% | 14.8% | 7.0% | 3.9% | 4.8% |
| October, 2013 | 7.0% | 4.8% | 3.5% | 3.6% | 12.2% | 3.7% | 15.8% | 7.3% | 3.9% | 4.9% |
| September, 2013 | 7.3% | 5.3% | 5.5% | 2.0% | 11.1% | 3.4% | 17.5% | 7.0% | 5.4% | 5.1% |
| August, 2013 | 7.2% | 5.2% | 3.3% | 2.9% | 11.4% | 4.2% | 16.2% | 7.5% | 5.0% | 5.2% |
| July, 2013 | 7.7% | 5.7% | 3.0% | 3.4% | 11.2% | 4.6% | 18.6% | 8.3% | 4.4% | 5.0% |
| June, 2013 | 7.3% | 5.0% | 3.8% | 2.6% | 11.3% | 3.8% | 16.3% | 7.9% | 5.1% | 6.1% |
| May, 2013 | 7.1% | 4.4% | 3.3% | 2.4% | 12.4% | 3.8% | 16.1% | 7.6% | 4.2% | 6.3% |
| April, 2013 | 6.9% | 4.9% | 3.7% | 2.4% | 13.3% | 3.4% | 15.7% | 6.2% | 4.8% | 5.3% |
| March, 2013 | 6.9% | 4.8% | 3.3% | 1.6% | 13.2% | 3.5% | 14.6% | 7.6% | 4.9% | 5.6% |
| February, 2013 | 6.6% | 4.3% | 3.8% | 2.4% | 13.2% | 2.0% | 13.6% | 7.0% | 4.3% | 5.9% |
| January, 2013 | 6.2% | 3.9% | 3.9% | 0.5% | 13.6% | 1.9% | 13.0% | 6.3% | 3.6% | 6.6% |
| December, 2012 | 5.0% | 2.5% | 1.6% | 1.6% | 11.4% | 0.9% | 11.5% | 4.5% | 5.3% | 4.4% |
| November, 2012 | 4.8% | 1.6% | 3.0% | 1.7% | 12.3% | 0.9% | 9.8% | 5.1% | 3.2% | 4.5% |
| October, 2012 | 4.7% | 3.7% | 3.3% | -0.2% | 11.5% | -0.1% | 8.8% | 4.8% | 3.2% | 5.0% |
| September, 2012 | 3.7% | 2.5% | 2.3% | 0.4% | 9.8% | -0.0% | 6.3% | 3.6% | 2.5% | 4.8% |
| August, 2012 | 4.0% | 2.8% | 1.2% | -0.4% | 10.2% | 0.8% | 7.2% | 4.3% | 3.3% | 4.6% |
| July, 2012 | 3.1% | 1.1% | 1.4% | -0.9% | 9.8% | 0.0% | 3.8% | 4.2% | 3.1% | 4.4% |
| June, 2012 | 3.1% | 2.0% | 2.9% | -0.4% | 9.5% | -0.6% | 4.8% | 3.5% | 2.8% | 2.5% |
| May, 2012 | 2.9% | 2.3% | 2.7% | -0.3% | 7.3% | -0.5% | 3.3% | 3.5% | 3.1% | 3.2% |
| April, 2012 | 2.0% | 2.1% | 2.0% | -2.0% | 5.8% | -2.3% | 1.4% | 3.3% | 1.9% | 2.9% |
| March, 2012 | 1.7% | 1.8% | 2.8% | -0.9% | 3.7% | 0.0% | 0.1% | 2.0% | 2.3% | 3.5% |
| February, 2012 | -0.4% | -1.2% | -0.2% | -2.9% | 1.3% | -1.0% | -2.2% | 0.2% | 1.2% | 1.8% |
| January, 2012 | -1.5% | -2.0% | -1.7% | -2.0% | -2.7% | -3.5% | -2.8% | -1.1% | 1.3% | 0.2% |
| December, 2011 | -1.6% | -1.7% | 1.7% | -3.2% | -1.7% | -1.7% | -4.5% | -1.6% | -2.1% | 1.6% |
| November, 2011 | -2.6% | -2.4% | -2.4% | -4.2% | -3.1% | -2.4% | -5.1% | -3.2% | -0.3% | 0.8% |
| October, 2011 | -3.4% | -4.5% | -2.5% | -4.1% | -5.8% | -3.0% | -5.3% | -3.0% | -1.5% | -0.1% |
| September, 2011 | -2.6% | -2.2% | -2.3% | -2.4% | -4.2% | -2.2% | -5.9% | -2.0% | -1.7% | -0.4% |
| August, 2011 | -4.1% | -3.8% | -1.9% | -2.5% | -6.6% | -3.6% | -6.9% | -4.6% | -3.2% | -2.5% |
| July, 2011 | -3.9% | -2.2% | -1.9% | -2.8% | -6.9% | -3.0% | -7.1% | -5.3% | -1.8% | -1.8% |
| June, 2011 | -4.6% | -3.7% | -2.9% | -3.4% | -7.8% | -2.6% | -7.6% | -6.4% | -4.3% | -0.9% |
| May, 2011 | -5.9% | -5.4% | -4.3% | -3.8% | -9.2% | -3.3% | -9.3% | -6.6% | -5.7% | -3.4% |
| April, 2011 | -5.8% | -5.8% | -4.1% | -2.4% | -10.4% | -2.1% | -8.4% | -7.8% | -5.6% | -2.2% |
| March, 2011 | -5.9% | -6.2% | -4.3% | -4.1% | -9.3% | -4.6% | -7.7% | -7.7% | -4.8% | -2.5% |
| February, 2011 | -5.1% | -4.2% | -3.7% | -4.1% | -9.4% | -3.0% | -7.3% | -6.2% | -4.8% | -2.4% |
| January, 2011 | -4.6% | -3.8% | -3.8% | -3.2% | -7.5% | -1.1% | -6.1% | -6.9% | -3.5% | -2.3% |
| December, 2010 | -4.0% | -3.4% | -4.7% | -2.9% | -7.2% | -2.7% | -5.2% | -4.6% | -3.0% | -2.5% |
| November, 2010 | -4.1% | -3.3% | -3.6% | -1.7% | -8.2% | -2.0% | -5.7% | -5.8% | -3.6% | -1.7% |
| October, 2010 | -3.5% | -2.0% | -4.2% | -1.1% | -6.2% | -1.8% | -4.7% | -5.3% | -3.1% | -2.6% |
| September, 2010 | -3.4% | -3.7% | -2.2% | -1.4% | -6.3% | -2.0% | -2.8% | -6.3% | -2.4% | -1.1% |
| August, 2010 | -2.6% | -2.3% | -3.0% | -1.9% | -5.9% | -0.9% | -2.7% | -4.2% | -1.8% | 0.0% |
| July, 2010 | -2.5% | -2.7% | -2.5% | -0.9% | -6.0% | -1.9% | -1.0% | -5.0% | -2.3% | 0.1% |
| June, 2010 | -2.3% | -2.9% | -3.9% | -0.0% | -5.6% | -1.6% | -0.9% | -3.7% | -0.9% | -0.9% |
| May, 2010 | -1.4% | -2.6% | -1.3% | -1.1% | -5.0% | -1.2% | 2.1% | -3.8% | -0.1% | 1.5% |
| April, 2010 | -1.5% | -2.2% | -1.8% | -1.5% | -4.8% | -3.9% | 1.3% | -2.7% | -0.7% | 0.9% |
| March, 2010 | -2.3% | -3.2% | -2.7% | -1.7% | -5.4% | -3.0% | 0.0% | -3.8% | -1.3% | -0.5% |
| February, 2010 | -3.4% | -4.1% | -2.6% | -1.0% | -7.9% | -5.1% | -1.2% | -6.0% | -2.9% | -0.3% |
| January, 2010 | -2.8% | -4.2% | -1.8% | -1.1% | -7.4% | -2.7% | -1.8% | -4.2% | -2.6% | 0.6% |
| December, 2009 | -2.0% | -2.2% | -1.3% | -0.7% | -7.4% | -0.8% | -2.3% | -3.1% | -0.6% | 1.0% |
| November, 2009 | -1.3% | -0.6% | -0.8% | -2.1% | -5.8% | -1.1% | -1.6% | -2.4% | 1.3% | 1.4% |
| October, 2009 | -3.3% | -3.2% | -0.8% | -2.2% | -7.8% | -2.5% | -4.8% | -5.8% | -1.1% | 0.7% |
| September, 2009 | -4.3% | -2.8% | -3.1% | -4.2% | -10.5% | -2.4% | -7.0% | -5.3% | -1.5% | -1.3% |
| August, 2009 | -5.0% | -4.6% | -2.0% | -3.4% | -10.8% | -3.2% | -8.3% | -7.4% | -2.1% | -0.2% |
| July, 2009 | -5.8% | -4.9% | -2.7% | -4.0% | -11.3% | -3.2% | -10.8% | -7.9% | -2.2% | -1.1% |
| June, 2009 | -6.4% | -4.9% | -2.1% | -4.6% | -12.5% | -3.9% | -12.6% | -9.2% | -2.3% | -0.2% |
| May, 2009 | -7.0% | -4.5% | -3.9% | -4.9% | -13.1% | -4.2% | -14.6% | -9.7% | -2.5% | -0.9% |
| April, 2009 | -8.1% | -6.1% | -4.1% | -4.5% | -13.3% | -4.0% | -16.4% | -11.9% | -3.3% | -1.2% |
| March, 2009 | -8.6% | -6.4% | -4.0% | -4.9% | -14.9% | -4.8% | -17.3% | -12.6% | -4.2% | -0.8% |
| February, 2009 | -8.3% | -6.1% | -3.8% | -4.9% | -13.1% | -4.1% | -19.0% | -11.5% | -2.3% | -1.1% |
| January, 2009 | -9.0% | -5.7% | -2.9% | -5.7% | -12.2% | -5.3% | -21.0% | -12.7% | -3.5% | -1.8% |
| December, 2008 | -10.4% | -8.0% | -4.7% | -6.0% | -13.6% | -6.9% | -21.4% | -15.2% | -4.9% | -2.4% |
| November, 2008 | -10.6% | -8.4% | -4.0% | -4.9% | -14.9% | -6.8% | -22.3% | -14.6% | -6.0% | -2.4% |
| October, 2008 | -9.6% | -7.4% | -3.3% | -5.1% | -13.5% | -5.9% | -22.1% | -13.1% | -3.4% | -1.4% |
| September, 2008 | -9.6% | -7.8% | -3.4% | -3.7% | -12.3% | -6.7% | -22.6% | -13.3% | -5.3% | -0.3% |
| August, 2008 | -9.1% | -7.0% | -2.5% | -4.2% | -12.2% | -6.8% | -21.9% | -12.3% | -3.7% | -1.2% |
| July, 2008 | -8.5% | -6.6% | -2.2% | -3.8% | -11.5% | -5.9% | -22.2% | -10.7% | -4.3% | 0.1% |
| June, 2008 | -8.1% | -6.7% | -1.9% | -3.9% | -10.5% | -5.5% | -21.2% | -10.6% | -3.5% | 0.7% |
| May, 2008 | -7.9% | -6.6% | -1.1% | -2.9% | -9.0% | -6.4% | -21.0% | -10.4% | -3.9% | 0.1% |
| April, 2008 | -7.4% | -6.5% | -1.5% | -4.0% | -9.0% | -5.1% | -20.2% | -8.9% | -3.1% | 0.5% |
| March, 2008 | -6.5% | -6.1% | -0.9% | -1.9% | -7.2% | -4.6% | -19.1% | -7.5% | -3.1% | 0.6% |
| February, 2008 | -5.3% | -5.4% | -0.2% | -1.2% | -5.2% | -2.5% | -15.1% | -7.2% | -3.1% | 1.3% |
| January, 2008 | -4.6% | -5.6% | -0.2% | -0.8% | -5.7% | -3.5% | -13.8% | -5.2% | -2.1% | 1.5% |
| December, 2007 | -3.5% | -4.5% | 1.1% | 0.0% | -4.8% | -2.4% | -11.8% | -4.7% | -0.4% | 2.8% |
| November, 2007 | -2.9% | -3.3% | 2.0% | -0.5% | -3.4% | -2.9% | -10.3% | -3.9% | -1.0% | 2.7% |
| October, 2007 | -1.9% | -3.3% | 2.4% | 0.1% | -2.4% | -2.2% | -8.0% | -2.4% | -1.0% | 3.7% |
| September, 2007 | -1.0% | -2.8% | 3.1% | 0.1% | 0.0% | -2.2% | -6.9% | -1.1% | 0.9% | 4.1% |
| August, 2007 | -0.6% | -1.9% | 2.8% | 0.2% | 0.9% | -1.7% | -6.4% | -0.5% | 0.2% | 4.7% |
| July, 2007 | 0.2% | -1.9% | 3.6% | 1.2% | 2.0% | -2.2% | -4.2% | 0.1% | 0.9% | 5.1% |
| June, 2007 | 0.6% | -1.1% | 4.2% | 0.9% | 2.5% | -2.3% | -3.9% | 1.2% | 1.3% | 5.0% |
| May, 2007 | 1.0% | -1.2% | 4.3% | 1.2% | 2.4% | -1.5% | -3.1% | 1.9% | 1.5% | 5.2% |
| April, 2007 | 1.7% | -1.1% | 5.1% | 1.9% | 3.9% | -1.5% | -1.5% | 2.5% | 1.8% | 5.9% |
| March, 2007 | 1.8% | -0.3% | 4.9% | 1.2% | 3.9% | -1.8% | -0.9% | 2.5% | 2.0% | 5.6% |
| February, 2007 | 1.8% | -0.4% | 5.2% | 1.5% | 3.9% | -2.6% | -2.3% | 3.5% | 2.2% | 5.8% |
| January, 2007 | 1.9% | 0.0% | 4.3% | 1.1% | 4.9% | -1.8% | -0.6% | 2.5% | 1.4% | 6.0% |
| December, 2006 | 2.2% | -0.1% | 5.5% | 1.4% | 5.8% | -1.7% | -1.0% | 3.8% | 1.2% | 5.7% |
| November, 2006 | 2.9% | -0.5% | 5.7% | 2.1% | 6.7% | -2.2% | 0.7% | 4.7% | 2.4% | 6.4% |
| October, 2006 | 3.2% | -0.0% | 6.1% | 3.0% | 7.2% | -2.0% | 0.8% | 5.5% | 2.5% | 6.1% |
| September, 2006 | 3.7% | 0.4% | 6.9% | 2.9% | 7.2% | -2.0% | 2.1% | 5.9% | 2.8% | 6.7% |
| August, 2006 | 4.7% | 1.2% | 7.0% | 4.4% | 8.9% | -0.6% | 4.2% | 6.6% | 3.3% | 7.2% |
| July, 2006 | 5.2% | 1.5% | 7.2% | 3.9% | 10.3% | -0.1% | 5.8% | 7.5% | 3.5% | 6.5% |
| June, 2006 | 6.4% | 1.8% | 7.8% | 6.6% | 11.7% | 1.4% | 8.1% | 8.8% | 3.6% | 6.9% |
| May, 2006 | 7.3% | 2.2% | 8.1% | 7.9% | 13.0% | 1.5% | 9.7% | 10.3% | 3.8% | 7.3% |
| April, 2006 | 7.8% | 2.4% | 7.8% | 8.1% | 13.5% | 2.5% | 11.6% | 11.7% | 3.8% | 6.8% |
| March, 2006 | 8.6% | 2.4% | 7.6% | 8.9% | 15.6% | 3.6% | 13.2% | 12.5% | 4.5% | 7.3% |
| February, 2006 | 9.2% | 3.1% | 7.6% | 9.0% | 15.9% | 3.9% | 15.5% | 13.1% | 4.7% | 7.3% |
| January, 2006 | 9.7% | 2.7% | 8.3% | 9.6% | 17.2% | 4.7% | 16.5% | 14.2% | 5.1% | 7.2% |
| December, 2005 | 9.8% | 2.8% | 7.4% | 9.5% | 17.4% | 5.1% | 17.1% | 14.6% | 5.0% | 7.0% |
| November, 2005 | 10.1% | 3.2% | 8.1% | 10.1% | 17.4% | 7.2% | 17.6% | 15.1% | 4.4% | 6.5% |
| October, 2005 | 10.5% | 3.6% | 7.0% | 10.4% | 18.0% | 6.8% | 19.5% | 14.8% | 5.0% | 6.8% |
| September, 2005 | 10.7% | 4.0% | 6.6% | 11.7% | 17.1% | 7.5% | 20.5% | 15.0% | 5.0% | 5.9% |
| August, 2005 | 10.6% | 3.4% | 6.3% | 11.6% | 17.6% | 8.0% | 20.3% | 15.4% | 5.0% | 5.6% |
| July, 2005 | 10.6% | 3.7% | 6.2% | 11.7% | 16.4% | 8.2% | 20.3% | 15.1% | 5.2% | 6.0% |
| June, 2005 | 10.4% | 3.8% | 5.8% | 10.6% | 16.2% | 8.4% | 20.5% | 15.3% | 5.2% | 5.3% |
| May, 2005 | 10.6% | 4.0% | 6.2% | 10.4% | 16.6% | 10.4% | 21.6% | 14.5% | 5.2% | 5.1% |
| April, 2005 | 10.7% | 4.2% | 6.2% | 11.4% | 15.5% | 10.2% | 22.3% | 14.3% | 6.0% | 4.6% |
| March, 2005 | 10.6% | 4.0% | 6.4% | 11.9% | 15.1% | 10.8% | 22.0% | 14.3% | 5.0% | 4.4% |
| February, 2005 | 10.3% | 3.4% | 5.4% | 10.8% | 15.1% | 11.0% | 22.2% | 13.8% | 5.1% | 4.7% |
| January, 2005 | 10.2% | 4.6% | 5.3% | 12.1% | 12.8% | 10.4% | 21.2% | 13.3% | 4.7% | 4.9% |
| December, 2004 | 10.2% | 4.0% | 5.8% | 11.9% | 12.9% | 9.9% | 22.2% | 13.2% | 5.3% | 4.3% |
| November, 2004 | 10.2% | 4.3% | 5.1% | 12.3% | 13.2% | 9.9% | 22.0% | 12.6% | 5.5% | 4.7% |
| October, 2004 | 10.0% | 4.3% | 4.7% | 12.4% | 12.3% | 11.2% | 21.4% | 12.7% | 5.5% | 4.3% |
| September, 2004 | 9.9% | 4.4% | 4.6% | 11.0% | 12.5% | 11.3% | 22.2% | 12.4% | 5.4% | 4.0% |
| August, 2004 | 9.9% | 4.7% | 5.0% | 11.4% | 11.7% | 12.0% | 22.0% | 12.1% | 5.6% | 4.0% |
| July, 2004 | 9.9% | 4.7% | 5.3% | 12.1% | 11.4% | 12.5% | 22.4% | 11.2% | 5.7% | 3.9% |
| June, 2004 | 9.9% | 4.9% | 5.0% | 12.3% | 11.2% | 11.9% | 21.9% | 10.9% | 5.9% | 4.4% |
| May, 2004 | 9.3% | 4.7% | 4.6% | 11.8% | 9.8% | 11.6% | 19.9% | 10.6% | 6.0% | 4.0% |
| April, 2004 | 8.8% | 4.6% | 4.4% | 11.4% | 9.5% | 10.9% | 18.1% | 10.1% | 5.5% | 3.9% |
| March, 2004 | 8.6% | 4.6% | 4.1% | 10.9% | 8.4% | 11.2% | 17.8% | 9.7% | 5.4% | 4.0% |
| February, 2004 | 8.1% | 4.6% | 4.2% | 11.2% | 7.8% | 10.8% | 16.5% | 8.8% | 5.6% | 3.2% |
| January, 2004 | 7.9% | 3.9% | 4.2% | 10.7% | 7.9% | 10.5% | 16.4% | 9.2% | 5.4% | 2.8% |
| December, 2003 | 7.9% | 4.8% | 4.2% | 10.9% | 7.1% | 11.1% | 16.2% | 8.4% | 5.1% | 3.1% |
| November, 2003 | 7.8% | 4.4% | 3.7% | 11.1% | 6.7% | 10.5% | 15.7% | 8.7% | 6.0% | 3.1% |
| October, 2003 | 7.6% | 4.8% | 4.0% | 10.8% | 6.6% | 10.4% | 14.7% | 8.3% | 5.6% | 3.0% |
| September, 2003 | 7.8% | 4.5% | 4.8% | 11.3% | 7.0% | 10.9% | 14.4% | 8.2% | 5.8% | 3.5% |
| August, 2003 | 7.6% | 4.7% | 4.1% | 11.1% | 5.9% | 10.0% | 13.8% | 8.6% | 5.7% | 3.5% |
| July, 2003 | 7.5% | 4.6% | 4.4% | 10.8% | 6.5% | 9.2% | 13.2% | 8.6% | 5.6% | 3.3% |
| June, 2003 | 7.4% | 4.3% | 4.3% | 11.0% | 6.0% | 10.8% | 13.1% | 8.3% | 5.3% | 3.1% |
| May, 2003 | 7.5% | 4.7% | 4.0% | 11.2% | 5.9% | 11.4% | 13.8% | 8.2% | 5.5% | 3.3% |
| April, 2003 | 7.6% | 4.6% | 4.1% | 11.6% | 5.7% | 12.2% | 14.4% | 8.0% | 5.5% | 3.2% |
| March, 2003 | 7.5% | 4.2% | 3.5% | 11.5% | 5.5% | 12.7% | 14.0% | 8.1% | 5.8% | 3.2% |
| February, 2003 | 7.8% | 4.6% | 4.5% | 12.4% | 5.3% | 12.3% | 14.6% | 8.0% | 6.1% | 3.6% |
| January, 2003 | 7.8% | 4.5% | 3.2% | 11.9% | 5.6% | 13.0% | 14.2% | 8.1% | 5.9% | 4.2% |
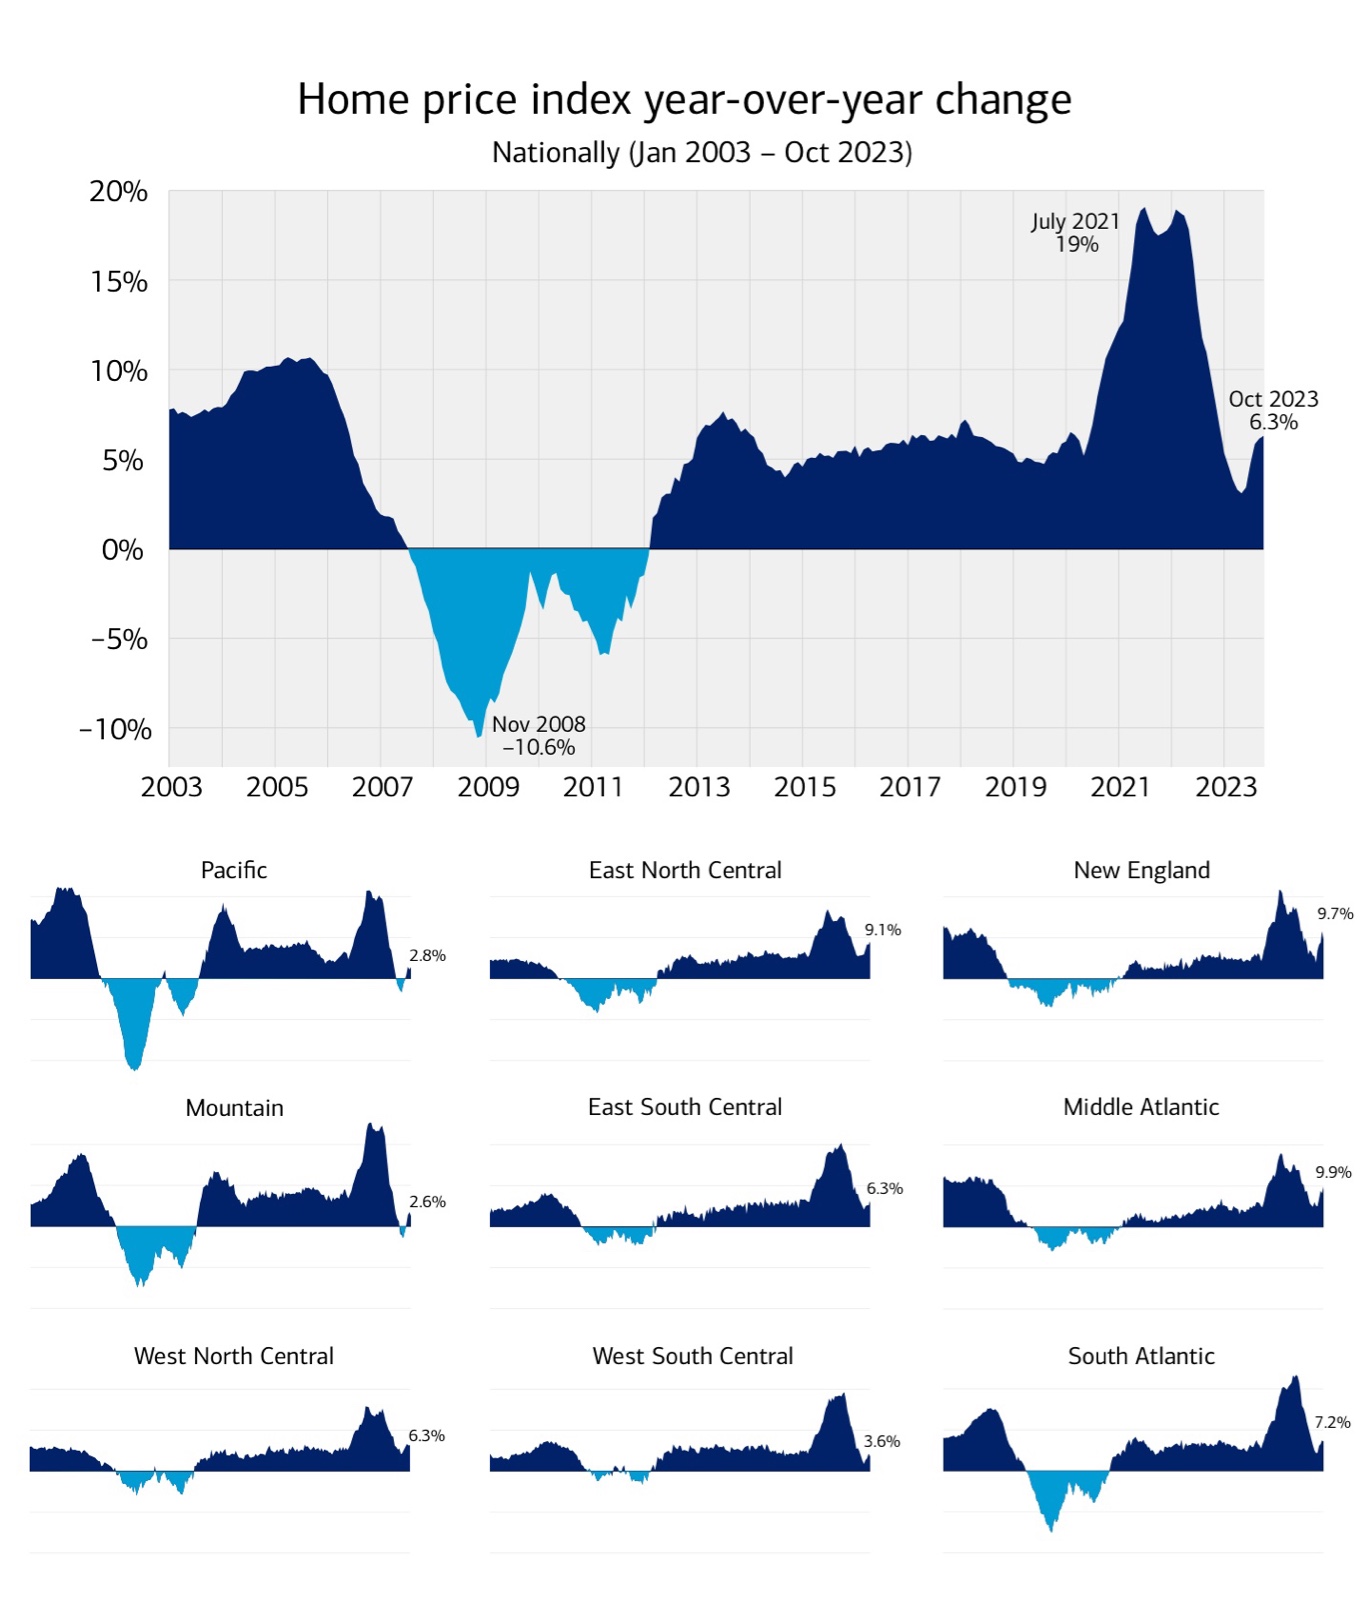
The Home Price Index measures the changes in single-family house prices in the U.S. as a percentage change from a chosen start date. As the graph shows, home prices have dropped considerably from their pandemic peak in July 2021 and year-over-year from 2022. The reasons for the drop are unambiguous: high interest rates and low inventory.
Let’s take a look at the current situation, the Fed’s influence, and the possible home pricing trend in 2024.
High interest rates
When interest rates were at 3% a few years back, a potential homeowner’s buying power was much stronger than when rates were at 7%.
Here’s a useful example: With a mortgage budget of $2,000 a month and a 3% interest rate, a homeowner could afford a home worth $474,400. At 7% interest, that same $2,000 a month gets a homeowner a property worth only $300,600, and that $474,400 home (that was $2,000 a month) now costs a remarkable $3,156 a month.
Sellers recognize this reality. They’ve had no choice but to lower their home prices to remain competitive in an economy where inflation is responsible for higher prices on so many goods and services.
Low inventory
The scenario mentioned above also accounts for the low inventory. Currently, two in three primary mortgages are 4% or lower.Footnote2 Although housing prices have risen since interest rates were that low, and those homeowners would make a nice profit if they sold, that profit is offset by the higher interest rate mortgage they’d get with their new home. This gives them the choice between getting much less home for the same monthly payment, or having a much higher monthly payment for a similar home.
That rock-and-a-hard-place choice has led to more homeowners staying put. The current market has a 3.6-month supply of home inventory (meaning that’s how long it would take to sell those homes at the current pace) instead of a five- to six-month supply, as we’d find in a healthier, more balanced housing market.Footnote3
The Fed
Although the Federal Open Market Committee (FOMC, or Fed) doesn’t set mortgage rates, the decisions it makes with regard to inflation and interest rates often have a direct effect on mortgage rates.
The Fed voted to keep interest rates unchanged for the third consecutive time in its final 2023 meeting, and pledged to cut rates three times by the end of 2024.Footnote4 The rate-hike pause allowed mortgage rates to drop slightly at the end of 2023, and that looks to be the trend for 2024 as well.
Bank of America’s own head of retail lending, Matt Vernon, says, “The Fed’s likely decision to cut rates in 2024 would be a key factor that could breathe new life into the housing market. However, it’s important to note that significant drops in mortgage rates might not happen in the early months of 2024. If any reductions occur, they are likely to be gradual, possibly beginning in the latter part of the year.”Footnote4
The good news is that even a 2% reduction in the interest rate represents a significant drop in a potential homebuyer’s monthly mortgage payment, and would bring a lot of potential homebuyers who’ve been priced out of the market back into the fold.
Nominal vs. real home prices
Our graph and this article focus on nominal home prices (not adjusted for inflation). When adjusted for inflation, the picture looks quite different. For instance, the year-over-year nominal home price growth for 2022 was 7.1%, but the real home price growth in that same time span was 0.0%.Footnote2 So, the dip in house prices in 2023 is even more dramatic when accounting for inflation.
Home pricing trends for 2024
The Fed meets eight times in 2024. There’s no way of predicting which three of those meetings will bring interest rate cuts that may have a direct effect on mortgage rates. If they continue to hold interest rates at where they are today, we may continue to see a slow and gradual decline in rates, continuing the trend of late 2023.
When the Fed does cut interest rates, the timing of those cuts, and the amount of the cuts, will determine how drastic or minimal the ripple effect will be on mortgage rates.
As mortgage rates drop, housing prices may start to rise again, but it seems unlikely either number will change as drastically in 2024 as in recent years. The housing market—as with the economy—seems to be trending toward stability.
Another promising development is the rise in single-family home construction permits; more permits were issued in October 2023 than in any other month last year.Footnote3 A rise in inventory may help counter the possible rise in home prices caused by lower interest rates.
The housing market has shown signs of gradual improvement for sellers and potential homeowners over the past few months. That trend looks to hold course—and hopefully significantly improve—by year’s end.
1 Federal Housing Finance Agency, Home Price Index (HPI), Data as of October 2023, Data pulled on December 27, 2023.
2 “Chart: U.S. Home Price Growth Over 50 Years.” Written by Dorothy Neufeld. Published June 28, 2023. Accessed January 2024.
3 “Buying a House in 2024: What to Expect.” Written by Abby Badach Doyle. Updated December 15, 2023. Accessed January 2024.
4 “Mortgage Rates Forecast For 2024: When Will Rates Finally Come Down?” Written by Robin Rothstein. Updated January 9, 2024. Accessed January 2024.
MAP6293545 | 02/2024