
Population continues to shift to the Sun Belt
| Metropolitan Statistical Area | 2021 Net Migration | 2021 Population Estimate |
|---|---|---|
| Phoenix-Mesa-Chandler, AZ | 70,097 | 4,946,145 |
| Dallas-Fort Worth-Arlington, TX | 62,921 | 7,759,615 |
| Tampa-St. Petersburg-Clearwater, FL | 45,625 | 3,219,514 |
| Austin-Round Rock-Georgetown, TX | 42,541 | 2,352,426 |
| Riverside-San Bernardino-Ontario, CA | 33,986 | 4,653,105 |
| Houston-The Woodlands-Sugar Land, TX | 31,921 | 7,206,841 |
| North Port-Sarasota-Bradenton, FL | 29,691 | 859,760 |
| Cape Coral-Fort Myers, FL | 26,813 | 787,976 |
| Charlotte-Concord-Gastonia, NC-SC | 26,652 | 2,701,046 |
| San Antonio-New Braunfels, TX | 26,622 | 2,601,788 |
| Jacksonville, FL | 25,857 | 1,637,666 |
| Lakeland-Winter Haven, FL | 25,517 | 753,520 |
| Atlanta-Sandy Springs-Alpharetta, GA | 25,049 | 6,144,050 |
| Boise City, ID | 24,261 | 795,268 |
| Raleigh-Cary, NC | 23,279 | 1,448,411 |
| Myrtle Beach-Conway-North Myrtle Beach, SC-NC | 21,921 | 509,794 |
| Deltona-Daytona Beach-Ormond Beach, FL | 19,414 | 685,344 |
| Port St. Lucie, FL | 16,645 | 503,521 |
| Las Vegas-Henderson-Paradise, NV | 15,395 | 2,292,476 |
| Knoxville, TN | 14,382 | 893,412 |
| Provo-Orem, UT | 13,912 | 697,141 |
| Nashville-Davidson--Murfreesboro--Franklin, TN | 13,234 | 2,012,476 |
| Palm Bay-Melbourne-Titusville, FL | 12,470 | 616,628 |
| Salisbury, MD-DE | 11,748 | 429,223 |
| Ocala, FL | 11,440 | 385,915 |
| Greenville-Anderson, SC | 11,238 | 940,774 |
| Oklahoma City, OK | 10,731 | 1,441,647 |
| Naples-Marco Island, FL | 10,724 | 385,980 |
| Orlando-Kissimmee-Sanford, FL | 9,939 | 2,691,925 |
| Punta Gorda, FL | 9,526 | 194,843 |
| St. George, UT | 9,204 | 191,226 |
| Fayetteville-Springdale-Rogers, AR | 9,123 | 560,709 |
| Charleston-North Charleston, SC | 8,882 | 813,052 |
| Tucson, AZ | 8,857 | 1,052,030 |
| Indianapolis-Carmel-Anderson, IN | 8,854 | 2,126,804 |
| Huntsville, AL | 8,832 | 502,728 |
| Sacramento-Roseville-Folsom, CA | 8,325 | 2,411,428 |
| Richmond, VA | 8,122 | 1,324,062 |
| Columbia, SC | 7,288 | 838,250 |
| Coeur d'Alene, ID | 7,283 | 179,789 |
| Prescott Valley-Prescott, AZ | 7,268 | 242,253 |
| Tulsa, OK | 7,207 | 1,023,988 |
| The Villages, FL | 7,105 | 135,638 |
| Daphne-Fairhope-Foley, AL | 6,843 | 239,294 |
| Greeley, CO | 6,730 | 340,036 |
| Spokane-Spokane Valley, WA | 6,714 | 593,466 |
| Spartanburg, SC | 6,632 | 335,864 |
| Portland-South Portland, ME | 6,436 | 556,893 |
| Stockton, CA | 6,199 | 789,410 |
| Winston-Salem, NC | 6,179 | 681,438 |
| Killeen-Temple, TX | 6,112 | 486,101 |
| Des Moines-West Des Moines, IA | 6,096 | 719,146 |
| Lake Havasu City-Kingman, AZ | 6,045 | 217,692 |
| Reno, NV | 5,988 | 497,535 |
| Homosassa Springs, FL | 5,977 | 158,083 |
| Wilmington, NC | 5,873 | 291,833 |
| Hilton Head Island-Bluffton, SC | 5,757 | 222,072 |
| Ogden-Clearfield, UT | 5,681 | 706,696 |
| Bend, OR | 5,638 | 204,801 |
| Pensacola-Ferry Pass-Brent, FL | 5,577 | 516,388 |
| Barnstable Town, MA | 5,448 | 232,411 |
| Crestview-Fort Walton Beach-Destin, FL | 5,441 | 293,324 |
| Springfield, MO | 5,349 | 481,483 |
| Asheville, NC | 5,194 | 472,341 |
| Chattanooga, TN-GA | 5,144 | 567,641 |
| Panama City, FL | 5,105 | 179,168 |
| Allentown-Bethlehem-Easton, PA-NJ | 4,977 | 865,310 |
| Columbus, OH | 4,950 | 2,151,017 |
| Sebastian-Vero Beach, FL | 4,695 | 163,662 |
| Clarksville, TN-KY | 4,596 | 328,304 |
| Hagerstown-Martinsburg, MD-WV | 4,352 | 298,227 |
| Augusta-Richmond County, GA-SC | 4,332 | 615,933 |
| Harrisburg-Carlisle, PA | 4,330 | 596,305 |
| Savannah, GA | 4,126 | 410,008 |
| Scranton--Wilkes-Barre, PA | 3,877 | 567,750 |
| Sherman-Denison, TX | 3,669 | 139,336 |
| Idaho Falls, ID | 3,644 | 162,786 |
| Kingsport-Bristol, TN-VA | 3,613 | 308,661 |
| Providence-Warwick, RI-MA | 3,504 | 1,675,774 |
| Poughkeepsie-Newburgh-Middletown, NY | 3,476 | 701,637 |
| Gainesville, GA | 3,304 | 207,369 |
| Bridgeport-Stamford-Norwalk, CT | 3,264 | 959,768 |
| Colorado Springs, CO | 3,249 | 762,793 |
| Merced, CA | 3,220 | 286,461 |
| Sebring-Avon Park, FL | 3,213 | 103,296 |
| Sioux Falls, SD | 3,174 | 281,958 |
| Tyler, TX | 2,910 | 237,186 |
| Logan, UT-ID | 2,846 | 152,083 |
| Bakersfield, CA | 2,805 | 917,673 |
| York-Hanover, PA | 2,775 | 458,696 |
| Greensboro-High Point, NC | 2,766 | 778,848 |
| Hickory-Lenoir-Morganton, NC | 2,668 | 366,441 |
| Billings, MT | 2,667 | 187,037 |
| Warner Robins, GA | 2,617 | 195,246 |
| Fort Collins, CO | 2,602 | 362,533 |
| Kennewick-Richland, WA | 2,531 | 308,293 |
| Winchester, VA-WV | 2,476 | 145,155 |
| Rapid City, SD | 2,469 | 141,979 |
| Bowling Green, KY | 2,372 | 182,594 |
| Burlington, NC | 2,322 | 173,877 |
| Gainesville, FL | 2,297 | 341,756 |
| Hartford-East Hartford-Middletown, CT | 2,289 | 1,211,906 |
| Auburn-Opelika, AL | 2,277 | 177,218 |
| Lubbock, TX | 2,273 | 325,245 |
| Little Rock-North Little Rock-Conway, AR | 2,161 | 750,936 |
| Gulfport-Biloxi, MS | 2,157 | 418,082 |
| College Station-Bryan, TX | 2,148 | 272,041 |
| Twin Falls, ID | 2,146 | 116,905 |
| Olympia-Lacey-Tumwater, WA | 2,129 | 297,977 |
| Durham-Chapel Hill, NC | 2,095 | 654,012 |
| Albany-Schenectady-Troy, NY | 2,076 | 899,286 |
| Madera, CA | 2,033 | 159,410 |
| Johnson City, TN | 2,029 | 208,068 |
| Cleveland, TN | 2,027 | 127,938 |
| Albuquerque, NM | 1,996 | 918,259 |
| Yuma, AZ | 1,984 | 206,990 |
| Waco, TX | 1,963 | 280,428 |
| Dover, DE | 1,953 | 184,149 |
| Kansas City, MO-KS | 1,916 | 2,199,490 |
| Athens-Clarke County, GA | 1,864 | 217,759 |
| Kingston, NY | 1,849 | 182,951 |
| Longview, TX | 1,810 | 287,868 |
| Morristown, TN | 1,790 | 143,855 |
| Salem, OR | 1,771 | 436,283 |
| Grand Junction, CO | 1,738 | 157,335 |
| Pueblo, CO | 1,712 | 169,622 |
| Fort Wayne, IN | 1,675 | 423,038 |
| Bellingham, WA | 1,668 | 228,831 |
| Manchester-Nashua, NH | 1,625 | 424,079 |
| Bangor, ME | 1,621 | 152,765 |
| Fayetteville, NC | 1,593 | 524,588 |
| Eugene-Springfield, OR | 1,583 | 383,189 |
| New Haven-Milford, CT | 1,569 | 863,700 |
| East Stroudsburg, PA | 1,545 | 169,273 |
| Dayton-Kettering, OH | 1,489 | 813,516 |
| Lynchburg, VA | 1,460 | 262,258 |
| Florence-Muscle Shoals, AL | 1,455 | 151,517 |
| Greenville, NC | 1,430 | 172,169 |
| Fort Smith, AR-OK | 1,420 | 245,459 |
| Hammond, LA | 1,413 | 135,217 |
| Columbia, MO | 1,408 | 213,123 |
| Youngstown-Warren-Boardman, OH-PA | 1,395 | 538,069 |
| Missoula, MT | 1,325 | 119,533 |
| Worcester, MA-CT | 1,318 | 978,447 |
| Cincinnati, OH-KY-IN | 1,296 | 2,259,935 |
| Ocean City, NJ | 1,272 | 95,661 |
| Las Cruces, NM | 1,241 | 221,508 |
| San Luis Obispo-Paso Robles, CA | 1,209 | 283,159 |
| Joplin, MO | 1,189 | 182,541 |
| Atlantic City-Hammonton, NJ | 1,184 | 274,966 |
| Eau Claire, WI | 1,166 | 173,317 |
| Medford, OR | 1,145 | 223,734 |
| Norwich-New London, CT | 1,129 | 268,805 |
| Charlottesville, VA | 1,126 | 222,688 |
| Albany-Lebanon, OR | 1,106 | 129,839 |
| Elizabethtown-Fort Knox, KY | 1,100 | 156,766 |
| Tallahassee, FL | 1,091 | 385,776 |
| Wenatchee, WA | 1,085 | 123,342 |
| Mount Vernon-Anacortes, WA | 1,052 | 130,696 |
| Burlington-South Burlington, VT | 1,048 | 226,611 |
| Iowa City, IA | 1,007 | 177,239 |
| Muskegon, MI | 980 | 176,511 |
| Grants Pass, OR | 940 | 88,346 |
| Sierra Vista-Douglas, AZ | 932 | 126,050 |
| Pocatello, ID | 927 | 96,213 |
| Brunswick, GA | 923 | 113,963 |
| Corvallis, OR | 916 | 96,017 |
| Dothan, AL | 912 | 151,618 |
| Redding, CA | 887 | 182,139 |
| Virginia Beach-Norfolk-Newport News, VA-NC | 887 | 1,803,328 |
| Wichita Falls, TX | 882 | 149,013 |
| Reading, PA | 876 | 429,342 |
| Jackson, TN | 851 | 180,799 |
| Monroe, MI | 846 | 155,274 |
| Canton-Massillon, OH | 829 | 400,525 |
| Ames, IA | 827 | 126,195 |
| Grand Rapids-Kentwood, MI | 820 | 1,091,620 |
| Fargo, ND-MN | 800 | 252,136 |
| Longview, WA | 792 | 111,524 |
| Hot Springs, AR | 791 | 100,330 |
| Macon-Bibb County, GA | 786 | 233,883 |
| Amarillo, TX | 769 | 269,703 |
| Janesville-Beloit, WI | 764 | 164,381 |
| Decatur, AL | 733 | 156,758 |
| Green Bay, WI | 715 | 329,490 |
| Bloomington, IN | 708 | 161,321 |
| Mansfield, OH | 705 | 125,195 |
| Staunton, VA | 704 | 125,774 |
| Muncie, IN | 689 | 111,871 |
| Gettysburg, PA | 688 | 104,127 |
| Pittsfield, MA | 684 | 128,657 |
| Lewiston, ID-WA | 660 | 64,851 |
| Carson City, NV | 654 | 58,993 |
| Chambersburg-Waynesboro, PA | 646 | 156,289 |
| Evansville, IN-KY | 638 | 313,946 |
| Santa Fe, NM | 626 | 155,201 |
| Roanoke, VA | 622 | 314,496 |
| Terre Haute, IN | 603 | 184,910 |
| Hattiesburg, MS | 583 | 173,078 |
| Morgantown, WV | 579 | 140,745 |
| Jefferson City, MO | 578 | 150,706 |
| Lawton, OK | 578 | 127,543 |
| Valdosta, GA | 573 | 149,152 |
| McAllen-Edinburg-Mission, TX | 569 | 880,356 |
| Lincoln, NE | 556 | 342,117 |
| Bismarck, ND | 539 | 134,417 |
| Lebanon, PA | 538 | 143,493 |
| Visalia, CA | 510 | 477,054 |
| Abilene, TX | 509 | 177,314 |
| New Bern, NC | 505 | 122,273 |
| Bloomsburg-Berwick, PA | 502 | 82,959 |
| Lafayette-West Lafayette, IN | 501 | 224,709 |
| Michigan City-La Porte, IN | 479 | 112,390 |
| Cape Girardeau, MO-IL | 443 | 97,699 |
| Baton Rouge, LA | 435 | 871,905 |
| Rome, GA | 432 | 98,771 |
| Akron, OH | 428 | 700,015 |
| Fond du Lac, WI | 424 | 104,362 |
| Duluth, MN-WI | 422 | 290,780 |
| Glens Falls, NY | 419 | 126,574 |
| Lancaster, PA | 408 | 553,652 |
| Appleton, WI | 405 | 244,084 |
| Lafayette, LA | 393 | 479,212 |
| Jonesboro, AR | 391 | 134,878 |
| Madison, WI | 385 | 683,183 |
| Springfield, OH | 376 | 135,633 |
| Cumberland, MD-WV | 374 | 94,586 |
| Lawrence, KS | 363 | 119,363 |
| Kokomo, IN | 355 | 83,687 |
| Yuba City, CA | 330 | 182,484 |
| Florence, SC | 308 | 199,259 |
| Gadsden, AL | 303 | 103,162 |
| Birmingham-Hoover, AL | 280 | 1,114,262 |
| Lewiston-Auburn, ME | 270 | 111,034 |
| Jackson, MI | 269 | 160,050 |
| Louisville/Jefferson County, KY-IN | 260 | 1,284,566 |
| Saginaw, MI | 258 | 189,591 |
| Harrisonburg, VA | 247 | 135,824 |
| Hinesville, GA | 237 | 82,863 |
| Great Falls, MT | 233 | 84,511 |
| Columbus, IN | 230 | 82,475 |
| Walla Walla, WA | 222 | 62,682 |
| California-Lexington Park, MD | 218 | 114,468 |
| Topeka, KS | 215 | 232,670 |
| Rocky Mount, NC | 202 | 143,535 |
| Texarkana, TX-AR | 180 | 147,174 |
| Corpus Christi, TX | 141 | 422,778 |
| Johnstown, PA | 116 | 132,167 |
| Champaign-Urbana, IL | 111 | 222,696 |
| Oshkosh-Neenah, WI | 79 | 171,623 |
| Anniston-Oxford, AL | 74 | 115,972 |
| Wausau-Weston, WI | 57 | 166,189 |
| Lexington-Fayette, KY | 43 | 517,846 |
| Battle Creek, MI | 32 | 133,819 |
| St. Cloud, MN | 32 | 200,406 |
| Williamsport, PA | 32 | 113,605 |
| Cheyenne, WY | 26 | 100,863 |
| Bay City, MI | 19 | 102,985 |
| Midland, MI | 13 | 83,457 |
| Sheboygan, WI | -17 | 117,747 |
| Rochester, MN | -31 | 227,151 |
| Parkersburg-Vienna, WV | -46 | 88,687 |
| Dalton, GA | -53 | 142,799 |
| Altoona, PA | -72 | 121,767 |
| Carbondale-Marion, IL | -75 | 132,907 |
| Beckley, WV | -85 | 113,698 |
| Ithaca, NY | -98 | 105,162 |
| State College, PA | -112 | 157,527 |
| Weirton-Steubenville, WV-OH | -169 | 115,585 |
| Owensboro, KY | -199 | 121,227 |
| Bloomington, IL | -209 | 170,889 |
| Lima, OH | -212 | 101,670 |
| Flagstaff, AZ | -218 | 145,052 |
| Omaha-Council Bluffs, NE-IA | -239 | 971,637 |
| Buffalo-Cheektowaga, NY | -256 | 1,162,336 |
| Lansing-East Lansing, MI | -260 | 540,281 |
| Wheeling, WV-OH | -269 | 137,740 |
| Mankato, MN | -274 | 103,612 |
| Vineland-Bridgeton, NJ | -284 | 153,627 |
| Montgomery, AL | -285 | 385,798 |
| Goldsboro, NC | -292 | 116,835 |
| Victoria, TX | -305 | 98,127 |
| Hanford-Corcoran, CA | -316 | 153,443 |
| Flint, MI | -331 | 404,208 |
| La Crosse-Onalaska, WI-MN | -335 | 139,211 |
| Fairbanks, AK | -336 | 95,593 |
| Farmington, NM | -339 | 120,993 |
| Blacksburg-Christiansburg, VA | -344 | 165,293 |
| South Bend-Mishawaka, IN-MI | -363 | 323,695 |
| Watertown-Fort Drum, NY | -380 | 116,295 |
| El Centro, CA | -404 | 179,851 |
| Waterloo-Cedar Falls, IA | -477 | 167,796 |
| Elmira, NY | -491 | 83,045 |
| Kankakee, IL | -491 | 106,601 |
| Racine, WI | -523 | 196,896 |
| Dubuque, IA | -530 | 98,718 |
| Pine Bluff, AR | -541 | 86,412 |
| Niles, MI | -546 | 153,101 |
| Sumter, SC | -548 | 135,782 |
| Danville, IL | -559 | 73,095 |
| Albany, GA | -584 | 147,773 |
| Kahului-Wailuku-Lahaina, HI | -592 | 164,221 |
| Houma-Thibodaux, LA | -597 | 206,212 |
| Tuscaloosa, AL | -600 | 268,191 |
| Fresno, CA | -608 | 1,013,581 |
| Erie, PA | -619 | 269,011 |
| St. Joseph, MO-KS | -625 | 120,424 |
| Toledo, OH | -631 | 644,217 |
| Casper, WY | -650 | 79,555 |
| Brownsville-Harlingen, TX | -658 | 423,029 |
| Alexandria, LA | -665 | 150,890 |
| Enid, OK | -691 | 61,926 |
| Binghamton, NY | -695 | 245,220 |
| Huntington-Ashland, WV-KY-OH | -751 | 356,581 |
| Utica-Rome, NY | -766 | 290,211 |
| Jacksonville, NC | -804 | 206,160 |
| Wichita, KS | -810 | 647,919 |
| Kalamazoo-Portage, MI | -812 | 261,108 |
| Springfield, MA | -850 | 695,305 |
| Grand Island, NE | -854 | 76,175 |
| Elkhart-Goshen, IN | -880 | 206,921 |
| San Angelo, TX | -890 | 122,344 |
| Grand Forks, ND-MN | -894 | 103,462 |
| Springfield, IL | -906 | 206,898 |
| Sioux City, IA-NE-SD | -923 | 149,265 |
| Mobile, AL | -944 | 428,220 |
| Decatur, IL | -976 | 102,432 |
| Charleston, WV | -1,058 | 255,020 |
| Cedar Rapids, IA | -1,162 | 275,435 |
| Trenton-Princeton, NJ | -1,186 | 385,898 |
| Napa, CA | -1,222 | 136,207 |
| Manhattan, KS | -1,243 | 133,932 |
| Bremerton-Silverdale-Port Orchard, WA | -1,289 | 274,314 |
| Anchorage, AK | -1,300 | 398,807 |
| Yakima, WA | -1,327 | 256,035 |
| Monroe, LA | -1,409 | 204,884 |
| Boulder, CO | -1,413 | 329,543 |
| Chico, CA | -1,439 | 208,309 |
| Davenport-Moline-Rock Island, IA-IL | -1,622 | 381,568 |
| Beaumont-Port Arthur, TX | -1,690 | 395,419 |
| Rockford, IL | -1,828 | 336,278 |
| Santa Rosa-Petaluma, CA | -1,880 | 485,887 |
| Modesto, CA | -1,920 | 552,999 |
| Columbus, GA-AL | -1,962 | 327,536 |
| Syracuse, NY | -1,996 | 658,281 |
| Laredo, TX | -2,086 | 267,945 |
| Peoria, IL | -2,295 | 398,224 |
| Rochester, NY | -2,355 | 1,084,973 |
| Vallejo, CA | -2,422 | 451,716 |
| El Paso, TX | -2,471 | 871,234 |
| Santa Cruz-Watsonville, CA | -2,602 | 267,792 |
| Ann Arbor, MI | -2,644 | 369,390 |
| Memphis, TN-MS-AR | -2,772 | 1,336,103 |
| Pittsburgh, PA | -3,128 | 2,353,538 |
| Shreveport-Bossier City, LA | -3,180 | 389,155 |
| Santa Maria-Santa Barbara, CA | -3,327 | 446,475 |
| Baltimore-Columbia-Towson, MD | -3,565 | 2,838,327 |
| Jackson, MS | -3,571 | 587,202 |
| Salinas, CA | -3,683 | 437,325 |
| Midland, TX | -3,763 | 173,180 |
| Salt Lake City, UT | -3,923 | 1,263,061 |
| Oxnard-Thousand Oaks-Ventura, CA | -4,454 | 839,784 |
| Cleveland-Elyria, OH | -4,912 | 2,075,662 |
| Denver-Aurora-Lakewood, CO | -5,448 | 2,972,566 |
| St. Louis, MO-IL | -5,840 | 2,809,299 |
| Odessa, TX | -5,878 | 161,091 |
| Portland-Vancouver-Hillsboro, OR-WA | -6,314 | 2,511,612 |
| Milwaukee-Waukesha, WI | -7,842 | 1,566,487 |
| New Orleans-Metairie, LA | -8,583 | 1,261,726 |
| Philadelphia-Camden-Wilmington, PA-NJ-DE-MD | -10,623 | 6,228,601 |
| Lake Charles, LA | -11,824 | 210,362 |
| Minneapolis-St. Paul-Bloomington, MN-WI | -12,629 | 3,690,512 |
| Urban Honolulu, HI | -13,686 | 1,000,890 |
| Detroit-Warren-Dearborn, MI | -16,682 | 4,365,205 |
| San Diego-Chula Vista-Carlsbad, CA | -22,149 | 3,286,069 |
| Seattle-Tacoma-Bellevue, WA | -24,169 | 4,011,553 |
| Miami-Fort Lauderdale-Pompano Beach, FL | -32,541 | 6,091,747 |
| Boston-Cambridge-Newton, MA-NH | -37,535 | 4,899,932 |
| San Jose-Sunnyvale-Santa Clara, CA | -49,412 | 1,952,185 |
| Washington-Arlington-Alexandria, DC-VA-MD-WV | -54,211 | 6,356,434 |
| Chicago-Naperville-Elgin, IL-IN-WI | -102,613 | 9,509,934 |
| San Francisco-Oakland-Berkeley, CA | -123,885 | 4,623,264 |
| Los Angeles-Long Beach-Anaheim, CA | -199,539 | 12,997,353 |
| New York-Newark-Jersey City, NY-NJ-PA | -361,774 | 19,768,458 |
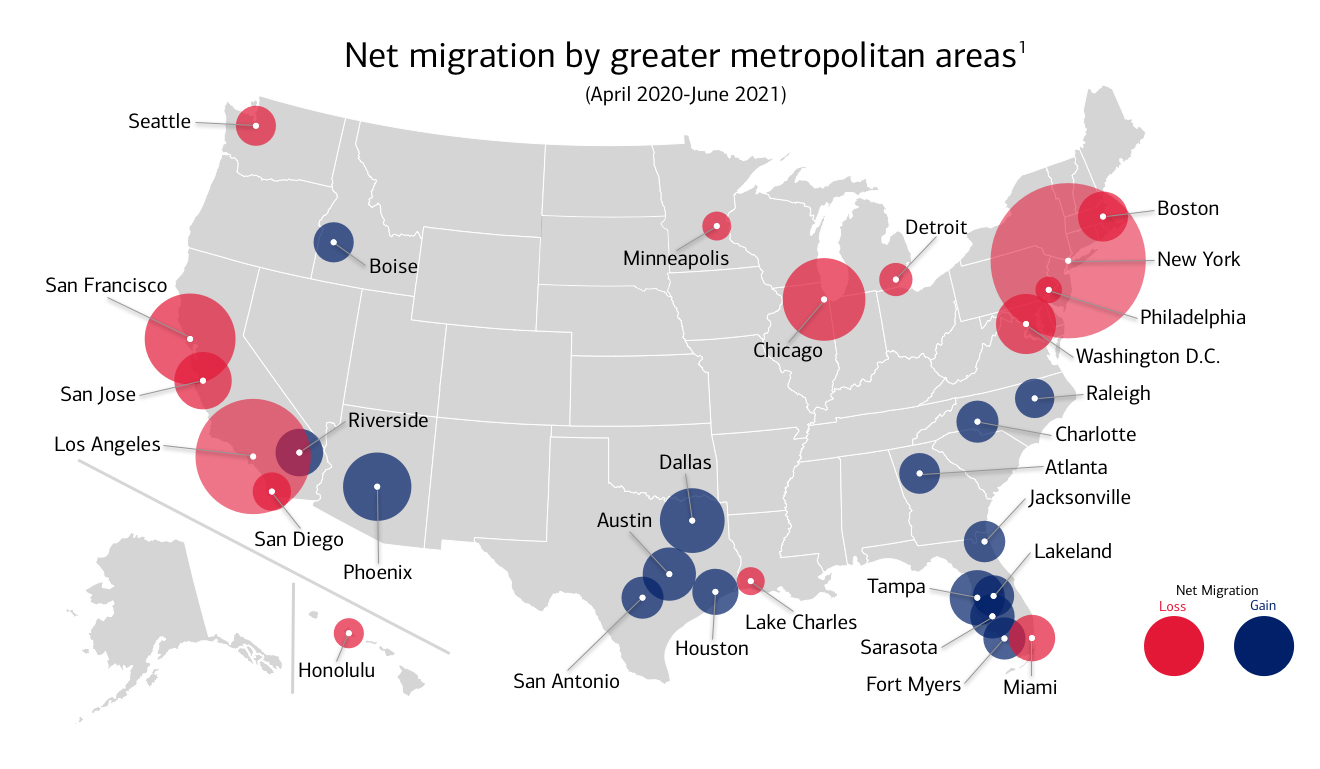
Through mid-2021, domestic relocation trends generally continued from the denser coastal cities, especially in the Northeast and California, to the Sun Belt cities from Florida to Texas to Arizona.
Using the nation's 384 Metropolitan Statistical Areas (MSAs) as the measure, the net migration change across the United States from April 2020 through June 2021 was just under 1.23 million residents from one MSA to another.Footnote1
The U.S. Office of Management and Budget (OMB) defines an MSA as having at least one urbanized area with a minimum population of 50,000, and includes its surrounding communities that are linked by social and economic factors.Footnote2 MSAs are high-density areas that include slightly more than 86% of the country's total population.
Recent migration to the Sun Belt was partially due to the excessive living costs of cities like New York, Boston, Chicago and Los Angeles. It also resulted from the newfound freedom of virtual work, especially for tech workers, that increased markedly during the pandemic. This extended the tech industry's ongoing relocation to the business-friendly Sun Belt, where cities are more affordable, modern and culturally burgeoning.
Surprising migration patterns
Looking at both the net migration areas on the map and the data in the accompanying table, a rather interesting, even surprising relationship emerges between the MSA locations that populations were moving from and the locations they were moving to.Footnote1
A very small number of MSAs accounted for the vast majority of people who moved to new metropolitan areas over the 15-month period in question. Specifically, out of the nearly 1.23 million individuals who relocated from their MSA, more than one million migrated from just 10 of the largest MSAs. Conversely, the top 10 destination MSAs accounted for less than 397,000 new residents.Footnote1
Comparing all 384 MSAs, 125 had a net negative migration and 259 had a net positive migration. The areas that lost individuals had an average population of 1.1 million, while those that made gains had a mean population of 570,000.Footnote1 Plus, those who moved — mostly from bicoastal and interior northern regions — spread out across the country, with the majority of them relocating to the Sun Belt.
The MSAsFootnote1 with the largest population declines:
- New York (-361,774)
- Los Angeles (-199,539)
- San Francisco (-123,885)
- Chicago (-102,613)
- Washington, D.C. (-54,211)
- San Jose (Calif.) (-49,412)
The MSAsFootnote1 with the largest population increases:
- Phoenix (+70,097)
- Dallas-Ft. Worth (+62,921)
- Tampa-St. Petersburg (+45,625)
- Austin (+42,541)
- Riverside-San Bernadino (Calif.) (+33,986)
- Houston (+31,921)
This movement continues the decades-long migration of a younger, tech-savvy workforce, as well as retirees, to more hospitable Sun Belt cities and their suburbs. For real estate professionals, this can translate into a steady stream of business, whether clients are selling in the North or buying in the South.
1 U.S. Census Bureau, Population Division — CBSA-EST2021-ALLDATA, March 2022 Release. Accessed October 2022.
2 Metropolitan Statistical Area (MSA): Definition and Uses, Investopedia, Akhilesh Ganti, August 25, 2022. Accessed November 2022.
MAP5352287 | 12/2022