Doors to homeownership are opening for younger buyers

| Age of Householder | Q2 2021 Home Ownership Rate | Q2 2022 Home Ownership Rate | Difference Bewtween Q2 2022 and Q2 2021 |
|---|---|---|---|
| United States Average | 65.4% | 65.8% | +0.4% |
| Under 25 years | 23.7% | 24.8% | +1.1% |
| 25 to 29 years | 34.2% | 35.8% | +1.6% |
| 30 to 34 years | 48.0% | 49.2% | +1.2% |
| 35 to 39 years | 59.1% | 58.4% | -0.7% |
| 40 to 44 years | 63.4% | 65.6% | +2.2% |
| 45 to 49 years | 66.8% | 69.1% | +2.3% |
| 50 to 54 years | 71.8% | 72.0% | +0.2% |
| 55 to 59 years | 73.9% | 73.5% | -0.4% |
| 60 to 64 years | 76.9% | 76.7% | -0.2% |
| 65 to 69 years | 79.2% | 78.9% | -0.3% |
| 70 to 74 years | 81.9% | 80.1% | -1.8% |
| 75 years and over | 78.5% | 79.1% | +0.6% |
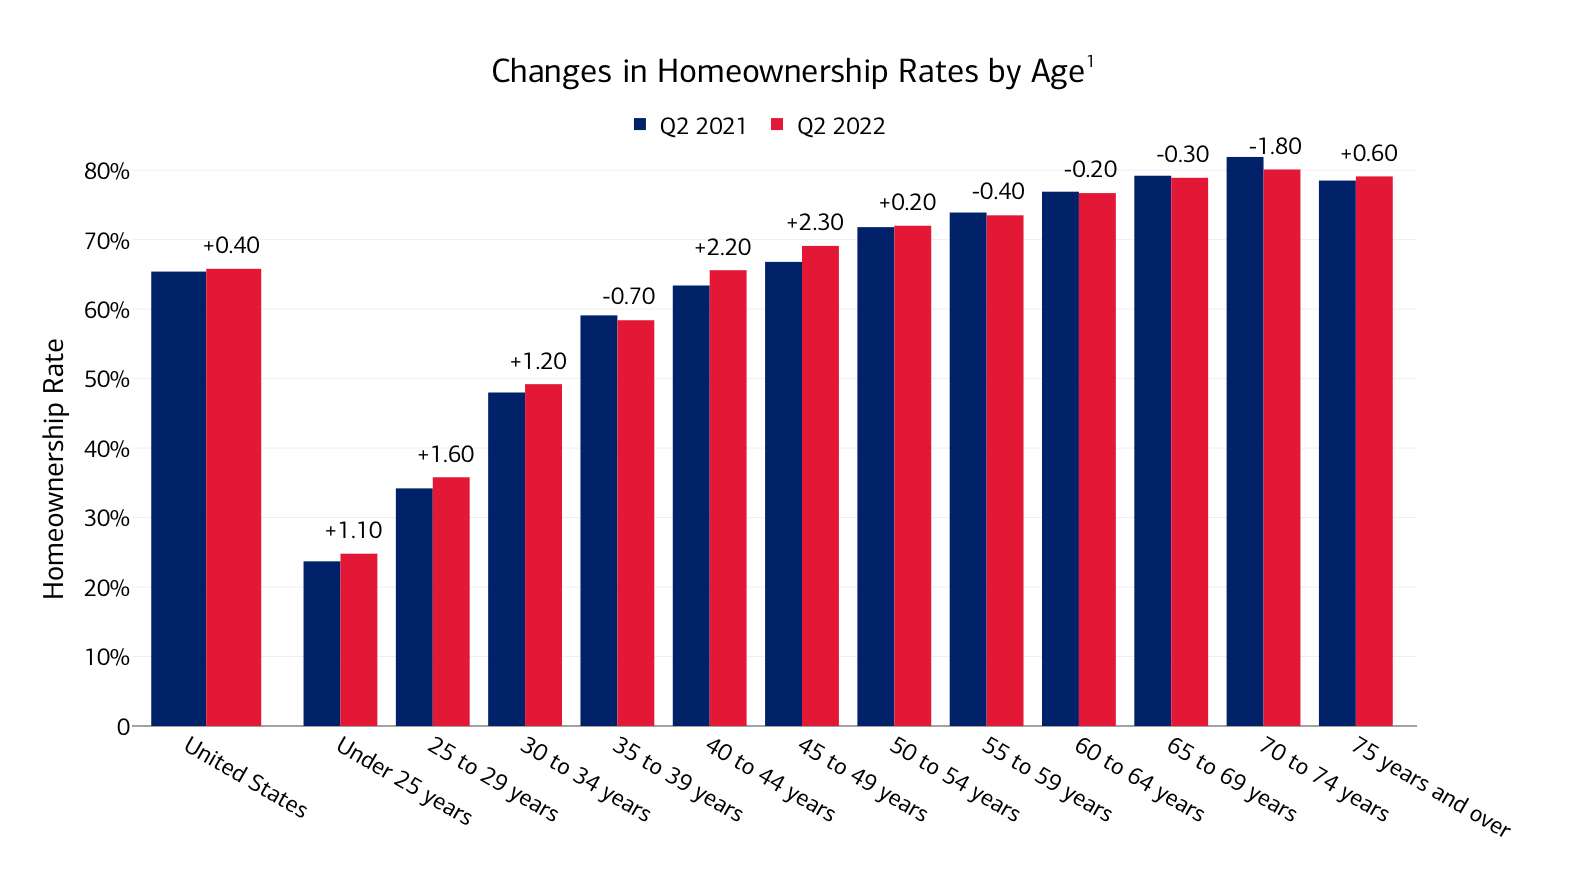
The most obvious and significant point about homeownership from the bar graph is that the older the demographic, the greater the ownership rate. As a general rule, this was as true decades ago as it is today.
Considering the graph's data, from Q2 2021 to Q2 2022, as a good indicator of current trends, the growth in homeownership is slowly shifting from boomers to the younger generations. In addition, the average national ownership rate of 65.80%,Footnote1 at the end of this period, corresponds to that of 43- and 44-year-olds.
More homes for Gen Xers and millennials
The largest growth in homeownership is in the range of 40- to 49-year-olds. This increase for older millennials and younger Gen Xers is a significant 2.25% for a one-year period.Footnote1 Importantly, this surge in ownership makes 40-somethings a prime demographic for your potential sales leads.
A substantial increase of 1.30% also occurred for those up to 34 years old, while 50- to 54-year-old Gen-Xers' ownership rose by a limited 0.20%.Footnote1 Curiously, for 35- to 39-year-olds, there was a decrease in ownership by 0.70%,Footnote1 which could simply be a statistical irregularity.
Fewer homes for boomers
This recent data shows that older Gen Xers and younger boomers are beginning to sell more often than purchase homes: For 55- to 69-year-olds, there was a minor dip in homeownership.Footnote1
Older boomers, in the 70- to 74-year-old demographic, exhibited a sharp 1.80% decline in homeownership during this same time period,Footnote1 indicating consequential change in some sellers' lives. Whether they moved in with family, retired to senior communities or rented, we only know that a good number decided to part with homeownership. For those 75 years and older, a surprising ownership uptick of 0.60%Footnote1 could simply mean that the youngest members of this age group, who just turned 75, owned more homes and added to the group's ownership total.
A historical perspective
Going back to 1994, how do the current homeownership figures stack up in comparison to the previous 26 years?
Overall, the trajectory of homeownership rose steadily from 1994 until the dot-com crash in 2001 - 02, then steadied until the Great Recession of 2008 - 09. In the Recession's aftermath, ownership declined for around six years. Then, between 2015 and 2018, homeownership reversed course and gradually climbed back to the rates of the late 1990s.Footnote1
Demographically, homeownership of 35- to 44-year-olds has been making a sustained comeback since 2015. The older generations, in contrast, starting with 45- to 54-year-olds, have held steady from 2015 to the present.Footnote1
A look ahead
Housing is now facing the dual headwinds of inflation and the ongoing housing shortage. At the same time, the resilient U.S. labor market should help many potential homebuyers continue to pursue the American dream.
1 U.S. Census Bureau, Current Population Survey/Housing Vacancy Survey, August 2, 2022. Accessed: September 2022.
MAP5093224 | 11/2022
